Interactive ETF catalog
Table of contents
Asset Class Blocks
Block Headers
Making your choices
The Bank Icon
The Bing information window
The MSN information window
Other information sources
Conclusion
The ETF catalog is designed to give you a good idea of what exists out there. The catalog is by no means complete, there are many more decent ETF’s available. The intention is to increase the number of ETF’s listed in the initial catalog, to increase choices for those who use the Asset Allocation Form (Portfolio Builder) to assemble a purchase list in line with their investor profile & geographical preference.
Asset Class Blocks
You will notice there are 7 asset class blocks, or individual ETF-lists if you like. At the time of writing, the catalog contained about 225 ETF’s to choose from. Going from left to right, you’ll find the following Asset Class blocks:
Global - Commodities
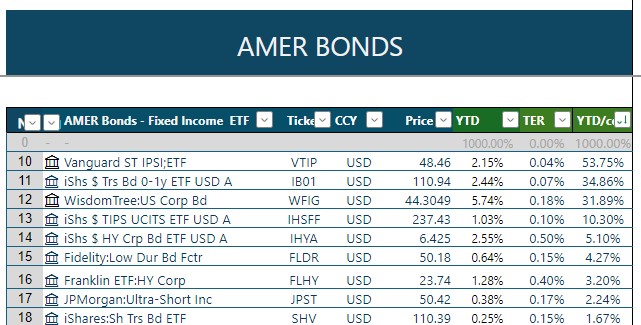
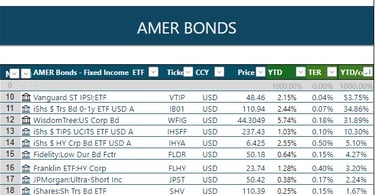
AMER - Bonds
EMEA - Bonds
APAC - Bonds
AMER - Equity
EMEA - Equity
APAC - Equity
Block Headers
Going from left to right, you’ll see the following headers:
Line number
Bank symbol
ETF name
Ticker code (this is NOT the ISIN code)
Currency
Price
YTD (Year To Date) performance
TER Total Expense Ratio (internal cost of the ETF)
YTD/cost
Check the AMER bonds example out just below to get an idea

Making your choices
Disclaimer : the ETF listing does NOT reflect preferences and is NOT investment advice.
That being said, it does give you a “plug and play” list to select from, dig deeper, and no doubt discover extra info and other ETF's that are not on this demo list. By now, an obvious question is how can you make a choice between all these? Let's clarify a few things to help out a bit.
ETF Name
The very first hurdle to take is that the names (as you find them in many databases) might just as well be written in Greek, Chinese or ancient hieroglyphs. Too often the ETF Name as such does not clearly reflect what is behind it.
We’ll get to the “bank symbol” last as this little icon opens up a wealth of possibilities to research further in-depth and take away that mys(t)ery.
Ticker
The ticker code of this ETF.
Be aware this is not the same as the ISIN code (!)
CCY
The currency this ETF is quoted in.
Price
Always refers to the last price BUT
be conscious they come with a delay that can go from 15 to 30 minutes.
YTD
This is the performance Year-To-Date, i.e. since Jan 1 of the current year.
Attention: this figure does not incorporate previous dividend payouts, if any.
TER
TER stand for Total Expense Ratioof a fund
This represents the real total internal cost of the fund.
YTD/cost
The performance year-to-date obtained per unit of internal cost.
The Bank Icon
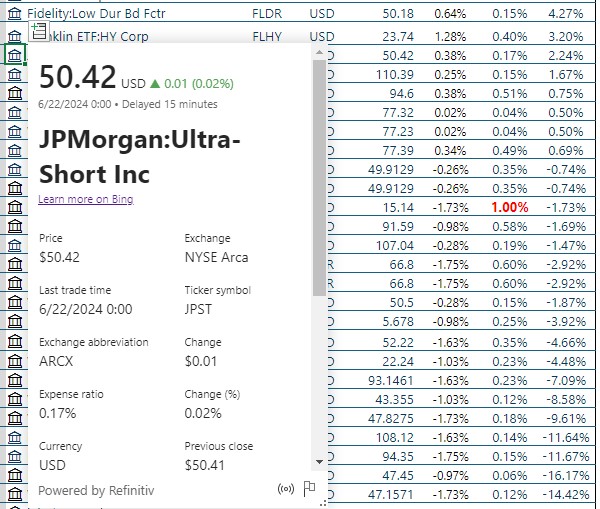
These are links which greatly help to find out more about an ETF. Let’s say we want to have a closer look at “JPMorgan: Ultra Short Inc”, even if the YTD performance may not seem inspiring (there is an excellent explanation for that as we’ll find out) and even if the TER is not really at rock-bottom levels compared to its peers. Click on the little bank icon left of the name and you’ll get a pop-up window with a sidebar for vertical scrolling, like this (June 24, 2024):
Bank Icon Pop-up window (a MS 365 function)
This pop-up gives a bit of extra info
ETF ticker code is JPST
TER (Expense Ratio) is confirmed to be 0.17%
VCurrency is USD
Last price was 50.42 USD, etc.
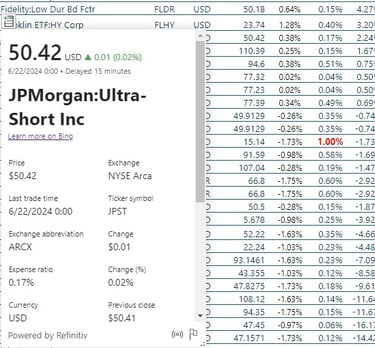
Scroll down and you’ll discover that market cap is a whopping 23 billion USD with a daily volume average of 3.6 million ETF’s. That shows this particular ETF is a serious player and very liquid (easily tradable).
However, this does not paint a complete picture yet. There is no graph so we do not know how this ETF behaved in the past nor do we know if we have to do with an accumulating or distributing (dividend paying) ETF. That is where the “Learn more on Bing” link comes in. Click on this link, placed right under the ETF name, and a web page opens up.
The Bing Information Window
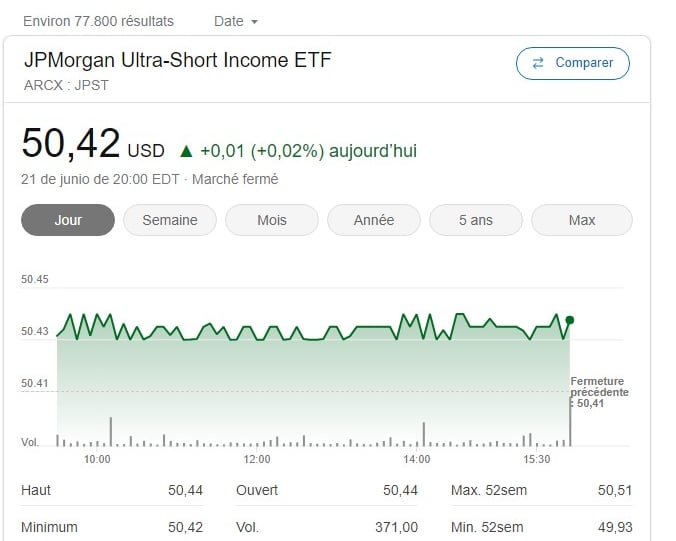
Having clicked on “Learn more on Bing”, you’ll get what I call a Bing Information Window on the top of a newly opened browser page. The Bing window is followed by a series of other suggestions related to this ETF. The top of the list is as shown below.
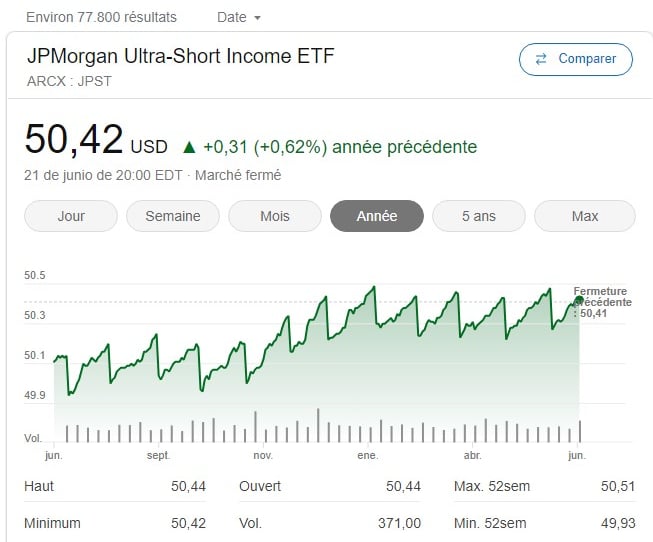
The opened graph (first by default) only represents prices in the course of 1 day (Jour) and it is easy to overlook this is not a long term performance graph. Click on the grey “Year” button (Année in French) and then you get another graph displaying how the ETF behaved over a rolling one-year period.
This totally changes the initial perception as obviously a monthly coupon is paid out. Again, this is not to be considered as investment advise, but is only shown to demonstrate that naked performance figures can be deceiving (as they may not incorporate dividend or interest payments) and always need to be placed in context.
In this specific case, the investor does receive a monthly payout, so it is quite normal that this ETF will not show a huge YTD in any listing. Lesson : always dig deeper ! And that's what we're going to do next. All you need to do is click on the name of the ETF shown in the header of the Bing information window.
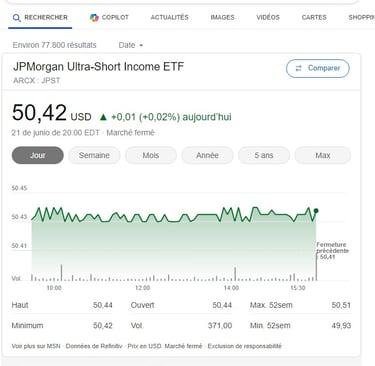
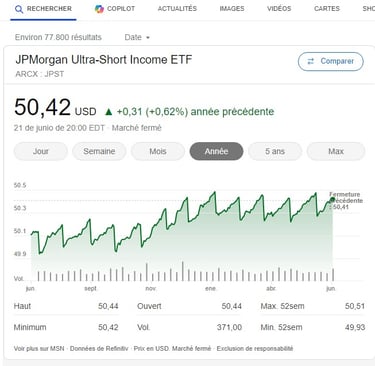
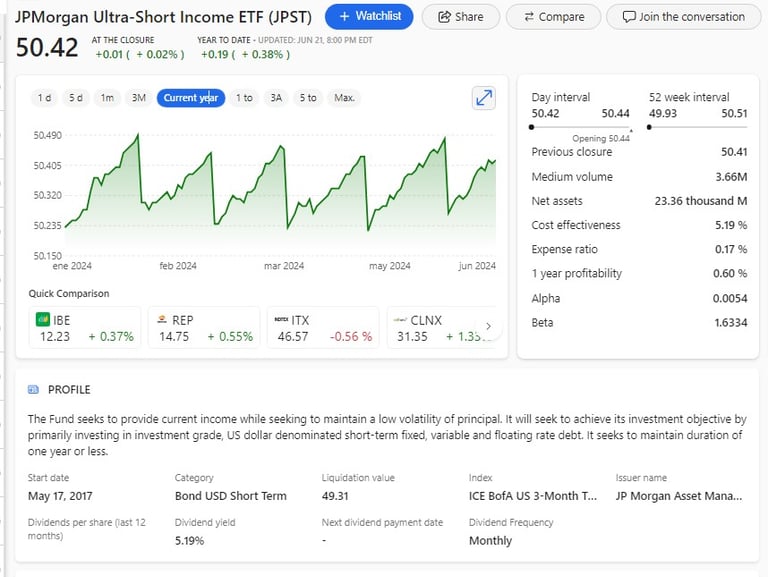
The MSN information window
Having done that, a MSN window opens up in a new browser page, giving you plenty of additional and useful information.
So far, you went to our ETF Catalog, choose an ETF to investigate, clicked on the bank symbol, from there opened a “Bing Window” and from there opened an “MSN Window”. Is there more? Absolutely. All you need to do is continue reading..
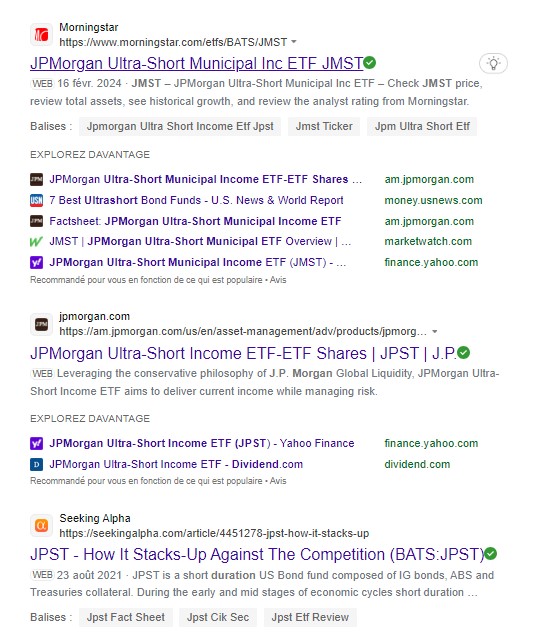
Other information sources
How to find this treasure?
Click on a “bank symbol” in the ETF catalog
Click on the “Learn more on Bing” link in the pop-up window
As we just saw, a new browser page opens up with a Bing-Window on top.
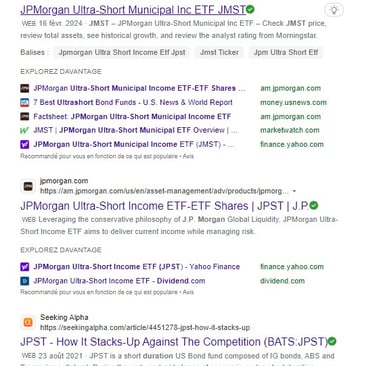
But here is the extra juice: just below the Bing window you will find a host of other links related to the ETF you are in the process of examining.
PROFILE
This summary description gives us a good idea of what exactly this fund does and their investment strategies put to work.
Dividend Yield 5.19%
This is to be understood as 5.19% per annum AND before any taxes.
Dividend Frequency
Monthly
To be clear: that is of course not 5.19% monthly, but each month the paid out “dividend” or “coupon” will be about 5.19% / 12 = 0.4325% pre-tax, on a non-interest compounding basis.
This is an excellent place to discover other finance sites like finance.yahoo, marketwatch, Morningstar, dividend.com etc. Explore and you’ll rapidly build up valuable investor knowledge.
Conclusion
The MyInvestmentAssistant.com ETF Catalog is your point of entry enabling you to dig much deeper and find out if a given ETF is a good fit you. Yes, that requires a little bit of your time to make an informed decision. That time is no doubt one of the best possible investments you can make.
Invest wisely and stay curious ( & subscribe ! )


MY INVESTMENT ASSISTANT
IMPORTANT INFORMATION
Subscribe and get a free quickstart and clickable financial website list pdf
Empowering Investors with tools