Daily Asset Allocation Grids
Generic Asset Allocations & your investor profile.
First of all, what does the term "Asset Allocation" actually mean ? Asset Allocation is how you distribute your investments over different asset classes. And the asset classes we use are cash, bonds (fixed income), equity (shares) and commodites
Your asset allocation is always a function of your investor profile. Asset allocation is very important since this hugely influences the kind of returns & volatility your portfolio is likely to have in the future.
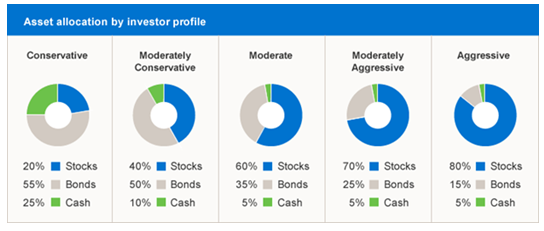
Static Asset Allocation guidance is standard in the industry. All show percentages for stocks and bonds, some add cash,some propose ranges which is already a step forward.
Yet, we still have no clue how much and where in the world to invest in each asset class under current economic circumstances. You may encounter profile allocations like the one below when browsing around in internet. We take it a step further.
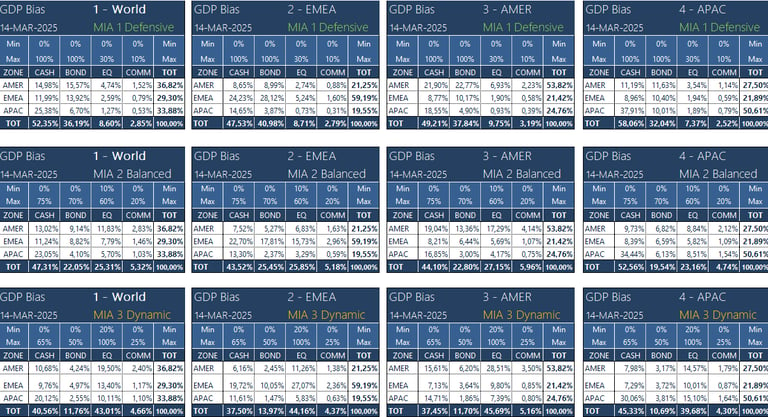
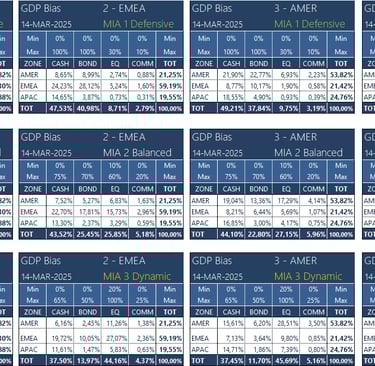
The above grids take standard static Asset Allocation next level by incorporating dynamic factors. How exactly are they different from "static" asset allocation guidance ? Our Asset Allocation grids are the result of :
1. Daily macro-economic monitoring
Key macro-economic data are monitored on a daily basis and any change is reflected in all the suggested asset allocation grids. This is the dynamic component of the approach.
2. Asset class ranges take your investor profile into account
Asset class ranges are pre-set for each investor profile and show the standard min-max range per asset class. This is a static component adapted to each of the three standard investor profiles that we use (Defensive, Balanced and Dynamic).
3. Geography & GDP skewing of your choice
You can choose between EMEA, AMER, APAC and World. EMEA stands for Europe, Middle East & Africa, AMER stands for the Americas, and APAC stands for Asia Pacific.
So, let's say you live in Europe, you would rather choose EMEA, when living in Asia you’d choose APAC. The selected geographic zone gives serious overweight (i.e. skewing or bias) to the GDP of the zone of your choice, which leads to higher percentages allocated to that geographical zone.
In case you manage a truly global portfolio,then you simply select “World”, and each of the 40 monitored countries is simply attributed its real GDP weight. The result of this approach gives us 12 "boxes", 1 row (4 geo zones) for Defensive profiles, 1 row (4 geo zones) for Balances profiles and 1 row (4 geo zones) for Dynamic profiles.
You can check these out under the "Asset Allocation" menu button.
All you need to do now is look into the grid that corresponds to your investor profile and geographic zone from time to time. If your allocation grid shows significant changes over time, then that signals it is time to re-evaluate your portfolio and adjust if needed.
Happy investing and stay curious ( & subscribe ! )
Myinvestmentassistant.com Asset Allocation grids
MY INVESTMENT ASSISTANT
IMPORTANT INFORMATION
Subscribe and get a free quickstart and clickable financial website list pdf
Empowering Investors with tools