Daily Macro Heatmap
Basics of the Economic Clock Principle (ECP)
The Daily Heatmap
is a product of the ECP principle & a graphical representation of which asset classes are likely to do better than their peers in the year to come for a given country. The heatmap is derived from 1-year forecasts of two key macro-economic indicators.
These indicators are fed into the Asset Allocation model which in turn guides us where (not) to invest in both asset class and geographical terms. The Economic Clock principle is now a widely recognized tool to work out asset allocations.
Input into the ECP
Two types of input are needed in this model
Country inflation trend
Country GDP growth trend
These key data can easily be retrieved from various sources. Even if they do not change every day, they are monitored on a daily basis just to be aware of any significant shifts in GDP growth or inflation trends.
Output of the ECP
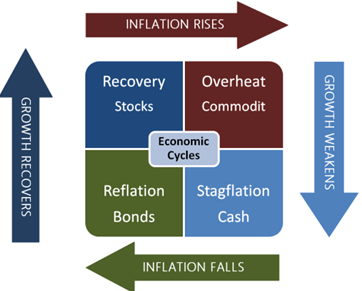
The original economic clock principle is based on GDP Growth trend & Inflation trend which gives us 4 possible outcomes for any country we monitor
Invest wisely and stay curious ( & subscribe ! )
As you can see, this gives us 4 possible outcomes AND an indication as to which asset class is likely to do better than peers in the coming year (based on 1-year forward looking forecasts). This is not pure science since telling the future never is, but the whole is based on economists’ observations over many years. This approach gives us four base-case scenarios :
Growth UP & Inflation DOWN > Equity is recommended
Growth UP & Inflation UP > Commodities are recommended
Growth DOWN & Inflation UP > Cash is recommended
Growth DOWN & Inflation DOWN > Fixed income (bonds) is recommended
Limitations of the ECP
Two main remarks to this model as far as myinvestmentassistant.com is concerned
There are only four asset classes in the model.
What about real estate or alternative investments for instance?
What happens if a trend is unclear?
In other words, when growth or inflation remains unchanged i.e. “flat”?
Our enhancements to the ECP
Introducing the notion of “FLAT” trends (available on this site)
Introducing two additional Asset Classes (not available on this site)
Introducing Flat Trends
Instead of having only “UP” or “DOWN” trends, the notion of a FLAT trend is introduced. In such a case, we allocate two asset classes (on a 50/50 basis) instead of just one to such a scenario. In other words, we diversify between the two outcomes that are most likely to outperform peers in a “flat” scenario.
The flipside of it ist that by doing so, we now suddenly have 9 possible base case scenarios per country instead of 4. Nevertheless, this enhancement is by default applied to ALL free asset allocation grids.
Introducing two additional Asset Classes
These are not available in the free asset allocation grids. Specific allocation grids can be worked out in a later stage for Family Offices, Wealth Managers and so on. In these advanced allocation grids, the new asset classes are given a fixed percentage (instead of a range) of the overall asset allocation.
Alternative investments
This is where you’d put real estate, passion investment, crypto and other
Core Portfolio
Some work with a “Core/Satellite” investment approach, and the notion of Core Portfolio handles just that. All we need to know is the internal asset allocation of your Core Portfolio in terms of Cash, Bonds, Equity, Commodities & Alternative Assets percentages + the total value. That’s it.
The Daily Heatmap
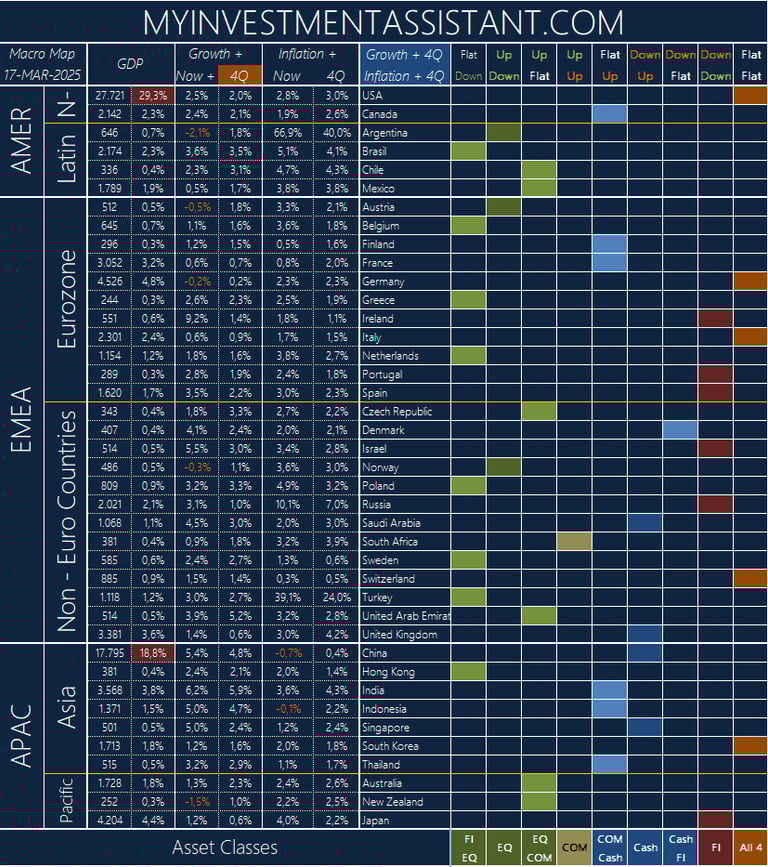
When applying all of the above principles to each of the 40 monitored countries, we get 40 outcomes that are put together into a heatmap. Here you see in a glance which country is in what part of its economic cycle and, at the bottom, what type of asset class is likely to do better than its peers for each given country.
In this case, notice that GDP heavyweights like the USA and China logically have a huge weight (= influence) on Asset Allocation Grids. Hence the possibility to opt for a GDP bias.
MY INVESTMENT ASSISTANT
IMPORTANT INFORMATION
Subscribe and get a free quickstart and clickable financial website list pdf
Empowering Investors with tools